Interpolation on earth surface (far from the dateline)
27 Oct 2022
- Introduction
- Why not do natural neighbor interpolation
- Getting the weights
- Making it faster with nearest neighbors
- Occlusion
- How to incorporate some curvature
- Review
- How to work near the dateline
Introduction
If you want to get the current temperature you could go outside, but you can also approximate it with interpolation. All over the world are public weather stations where you can get the current temperature there.
You could just take the nearest to your home and believe it, which often is fine, but let’s do better anyway. You can take the ones around you and use the average of them. Even better you weigh them and take give the values nearer you more relevance. In other words: You interpolate their temperatures at your current location.
In this article, I will discuss how you figure out which stations are around you and how you weigh them and how you can do that kind of fast with a computer.
“Around you” is surprisingly hard to define and figure out. The simplest way is to take the k nearest stations, but this does ignore a central problem: occlusion. If there are two information sources in a line from you, you always only want to look at the first of them and the farther behind and occluded ones should almost always be ignored.
Now the title of this post says we only do interpolation far from the date line. As you almost surely know a point on the earth is often addressed with a latitude and longitude which are basically angles. As always with angles they skip somewhere from 360 degrees back to 0 degrees. On the earth, this is defined to happen in the region of the pacific. This is messy to handle and you don’t always need it. For example, I work with the data from the Germanys public weather service which is only really good inside of Germany and Germany is very far from the pacific. Luckily Germany also does not have colonies anymore.
Why not do natural neighbor interpolation
(You can safely skip this paragraph if you don’t know what natural neighbor interpolation is or you know what it is and don’t like it at all)
If you have ever looked at multidimensional interpolation you heard of natural neighbor interpolation. This is a really clever algorithm based on Voronoi diagrams. It automatically handles occlusion and it gives a kind of natural way to get the weights without having to mess around.
I think it is a brilliant idea and I don’t like it at all. I collaborated on a based on this principle some time ago and I don’t like it very much anymore. This algorithm is horrible to implement fast and even then it is still slow. It is a mess of numerical problems if points have too much symmetry. And implementation is only the smallest problem.
Naturalness is very nice because you don’t have to tune any parameters. Until your and the algorithm’s definition of naturalness is not the same. Then you want to tune parameters and you can’t. For example, on earth, the distance on the surface is not the same as the distance between the coordinates as vectors. There is no direct way to make this work with natural neighbor interpolation.
Someone clever might figure out how to make this work for this special case. I’m sure that will make the algorithm even more horrible to implement efficiently and you can’t reuse it for the next modification. For example, you might want to include the different elevations of the weather stations, because it turns out the temperature on the next mountain is not that applicable in the valley below. Let us use something else.
Getting the weights
Getting the weights between the at a target location from the source stations is easy from their distance. For any station, you take the distance and apply a decreasing function to it.
Classically you use a weight[i] = 1/pow(distance[i], e) for some exponent e which is usually at least 21. Now the sum of all weights is not 1 as it should be so you have to calculate their sum and divide each weight by the sum.
In swift, this could look like the following2
func interpolate(datapoints: [Double], distances: [Double]) -> Double{
    let weights = distances.map{distance in 1.0/pow(distance, 2)}
    let weightSum = weights.sum()
    let normalizedWeights = weights.map{weight in weight/weightSum}
    let interpolated = zip(normalizedWeights, datapoints).map{ weight, data in
        return weight*data
    }.sum()
    return interpolated
}
You can use any decreasing function of the distance. I kind of like a shifted and mirrored sigmoid functions, but it is fun and easy to try different functions that come to your mind.
We can also put anything else into this formula. For example, we might add 100m more distance for every 1m of elevation difference.
To get the distance it might work fine to ignore the curvature of the earth and assume longitude and latitude are a flat grid3 and take their distance with the Pythagoras theorem. If your stations are near enough this works fine, but we can do better and use the real distance on the earth’s surface. This is easy to calculate by using the (Haversine formula)[https://rosettacode.org/wiki/Haversine_formula]4.
Making it faster with nearest neighbors
So until now, we look at every station in (potentially) the world and this sounds like a lot of useless work. So let us just get the nearest ones. In most cases k=5-10 stations are enough.
A simple way to do this is to loop through all stations and put them into a max-heap ordered by the distance. Whenever the heap contains more than k values you can remove the most distant one to keep the heap small and efficient. So in the end the heap will contain the k nearest stations.
This can be done much more efficiently by using bounding volume hierarchys5. If the heap contains at least k element its max is always the farthest a relevant point can ever be. We can use its distance to prune large parts of the bounding volume hierarchy.
We could use the correct distance, but this will get messy real fast when we want to use the bounding volume hierarchy. Just use the simple Pythagorean distance!
The simplest implementation of this might look something like this:
func KNN(_ k: Int, at: Vec2, from sources: [Station]) -> [Station]{
    var heap = BinaryHeap<Station>(withComparision: {a, b in Vec2.distance(at, a.position()) >= Vec2.distance(at, b.position())})
    for point in sources{
        heap.insert(point)
        if heap.count > k{
            heap.extract()
        }
    }
    var ret = [Station]()
    while heap.count > 0{
        ret.append(heap.extract()!)
    }
    return ret
}
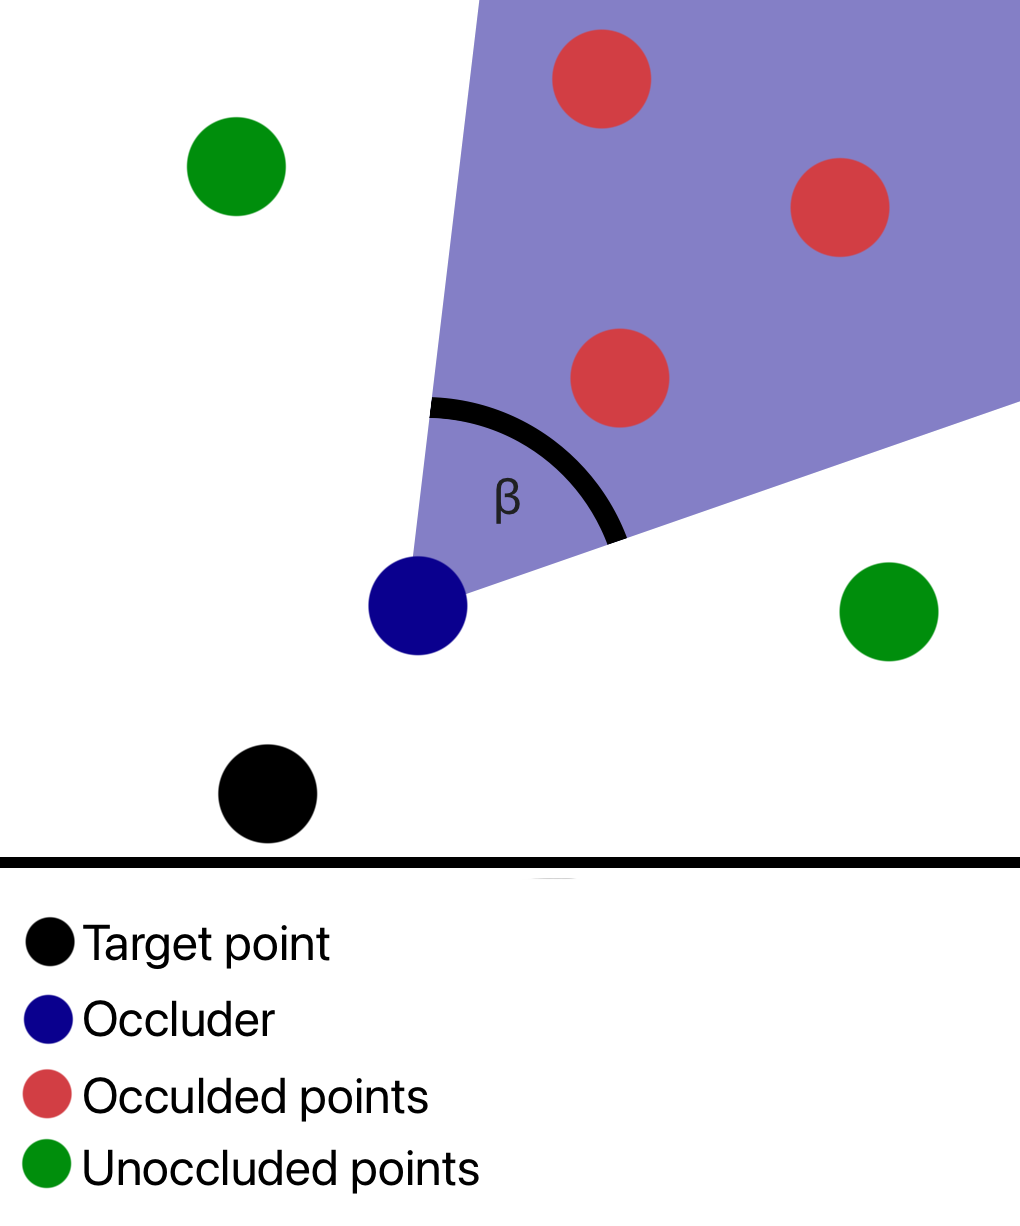
Occlusion
Now we got a few nearest points left we can do occlusion. So let’s just do the simplest thing possible. For each point we define an area behind it, that is occluded from the view of our target location. So for every station, we check which other stations are in the occluded area and throw them away.
We same basic linear algebra and trigonometry you can work this out and you might find the following:
func isOccluded(from source: Vec2, occluder: Vec2, occluded: Vec2, openingAngle: Double = 45) -> Bool{
    let limit = cos(openingAngle*Double.pi/180)
    if occluded == occluded{
        return false
    }
    let normal = (occluder-source).normalize()
    let cos = normal.dot(occluded-occluder)/Vec2.distance(occluder, occluded)
    return cos > limit
}
Now we can check each pair of stations and reject all that is occluded in any way and we are done. Because we only have a few nearest stations this is fast enough for most practical applications and we don’t need to think of a more clever algorithm to do this.
I use an opening angle of 45°, but you might tune this to your liking and application.
How to incorporate some curvature
Until now we ignored the curvature of the earth for the most part, but this is simple enough to fix.
We can take something like 30% more nearest neighbors than we really want. Now we sort these by the correct surface distance and only take the nearest k of them. So after that, we have almost surely the nearest points considering curvature with very little more work.
Review
So let us review what we do
- Think of a target point for our interpolation
- Find a little more than
knearest stations with some approximations maybe with the help of a bounding volume hierarchy - Select the real nearest
kfrom them - Check which ones are occluded by others and ignore them
- Calculate the weights from the distance to the target point and make them sum up to 1
- Get the weighted average of the temperature
- Go for a walk with temperature adequate cloth
This obviously works for any other positions on earth than stations and any other quantity than temperature.
How to work near the dateline
So this only works when the latitude and longitude are near enough to normal rectangular coordinates. This definitely does not hold near the date line. So what to do there?
The trick is not to use latitude and longitude. We can simply use a 3D coordinate system for the earth which are always well behaved. It is simple to calculate the positions in real space and it turns out bounding volume hierarchies and our occlusion code generalizes without any problems to 3D. It only gets a little slower to calculate.
For the calculation of the weights, we might want to go back to the latitude and longitude because that formula works perfectly well with the date line.
-
This is called Shepard’s method. ↩
-
For this to work sum must be defined something like this
extension Sequence where Element: BinaryFloatingPoint{ func sum() -> Element{ return self.reduce(0.0, +) } } -
This is basically a Mercator projection, which is often used for world maps. ↩
-
Vincenty’s formula is even more precise and considers that the earth is more an ellipsoid and not a perfect sphere. I’m pretty sure you don’t need this for interpolation. ↩
-
This article series is a really good overview for conventional bounding volume hierarchies. I like to do this rather differently and will try to write it down one day. ↩